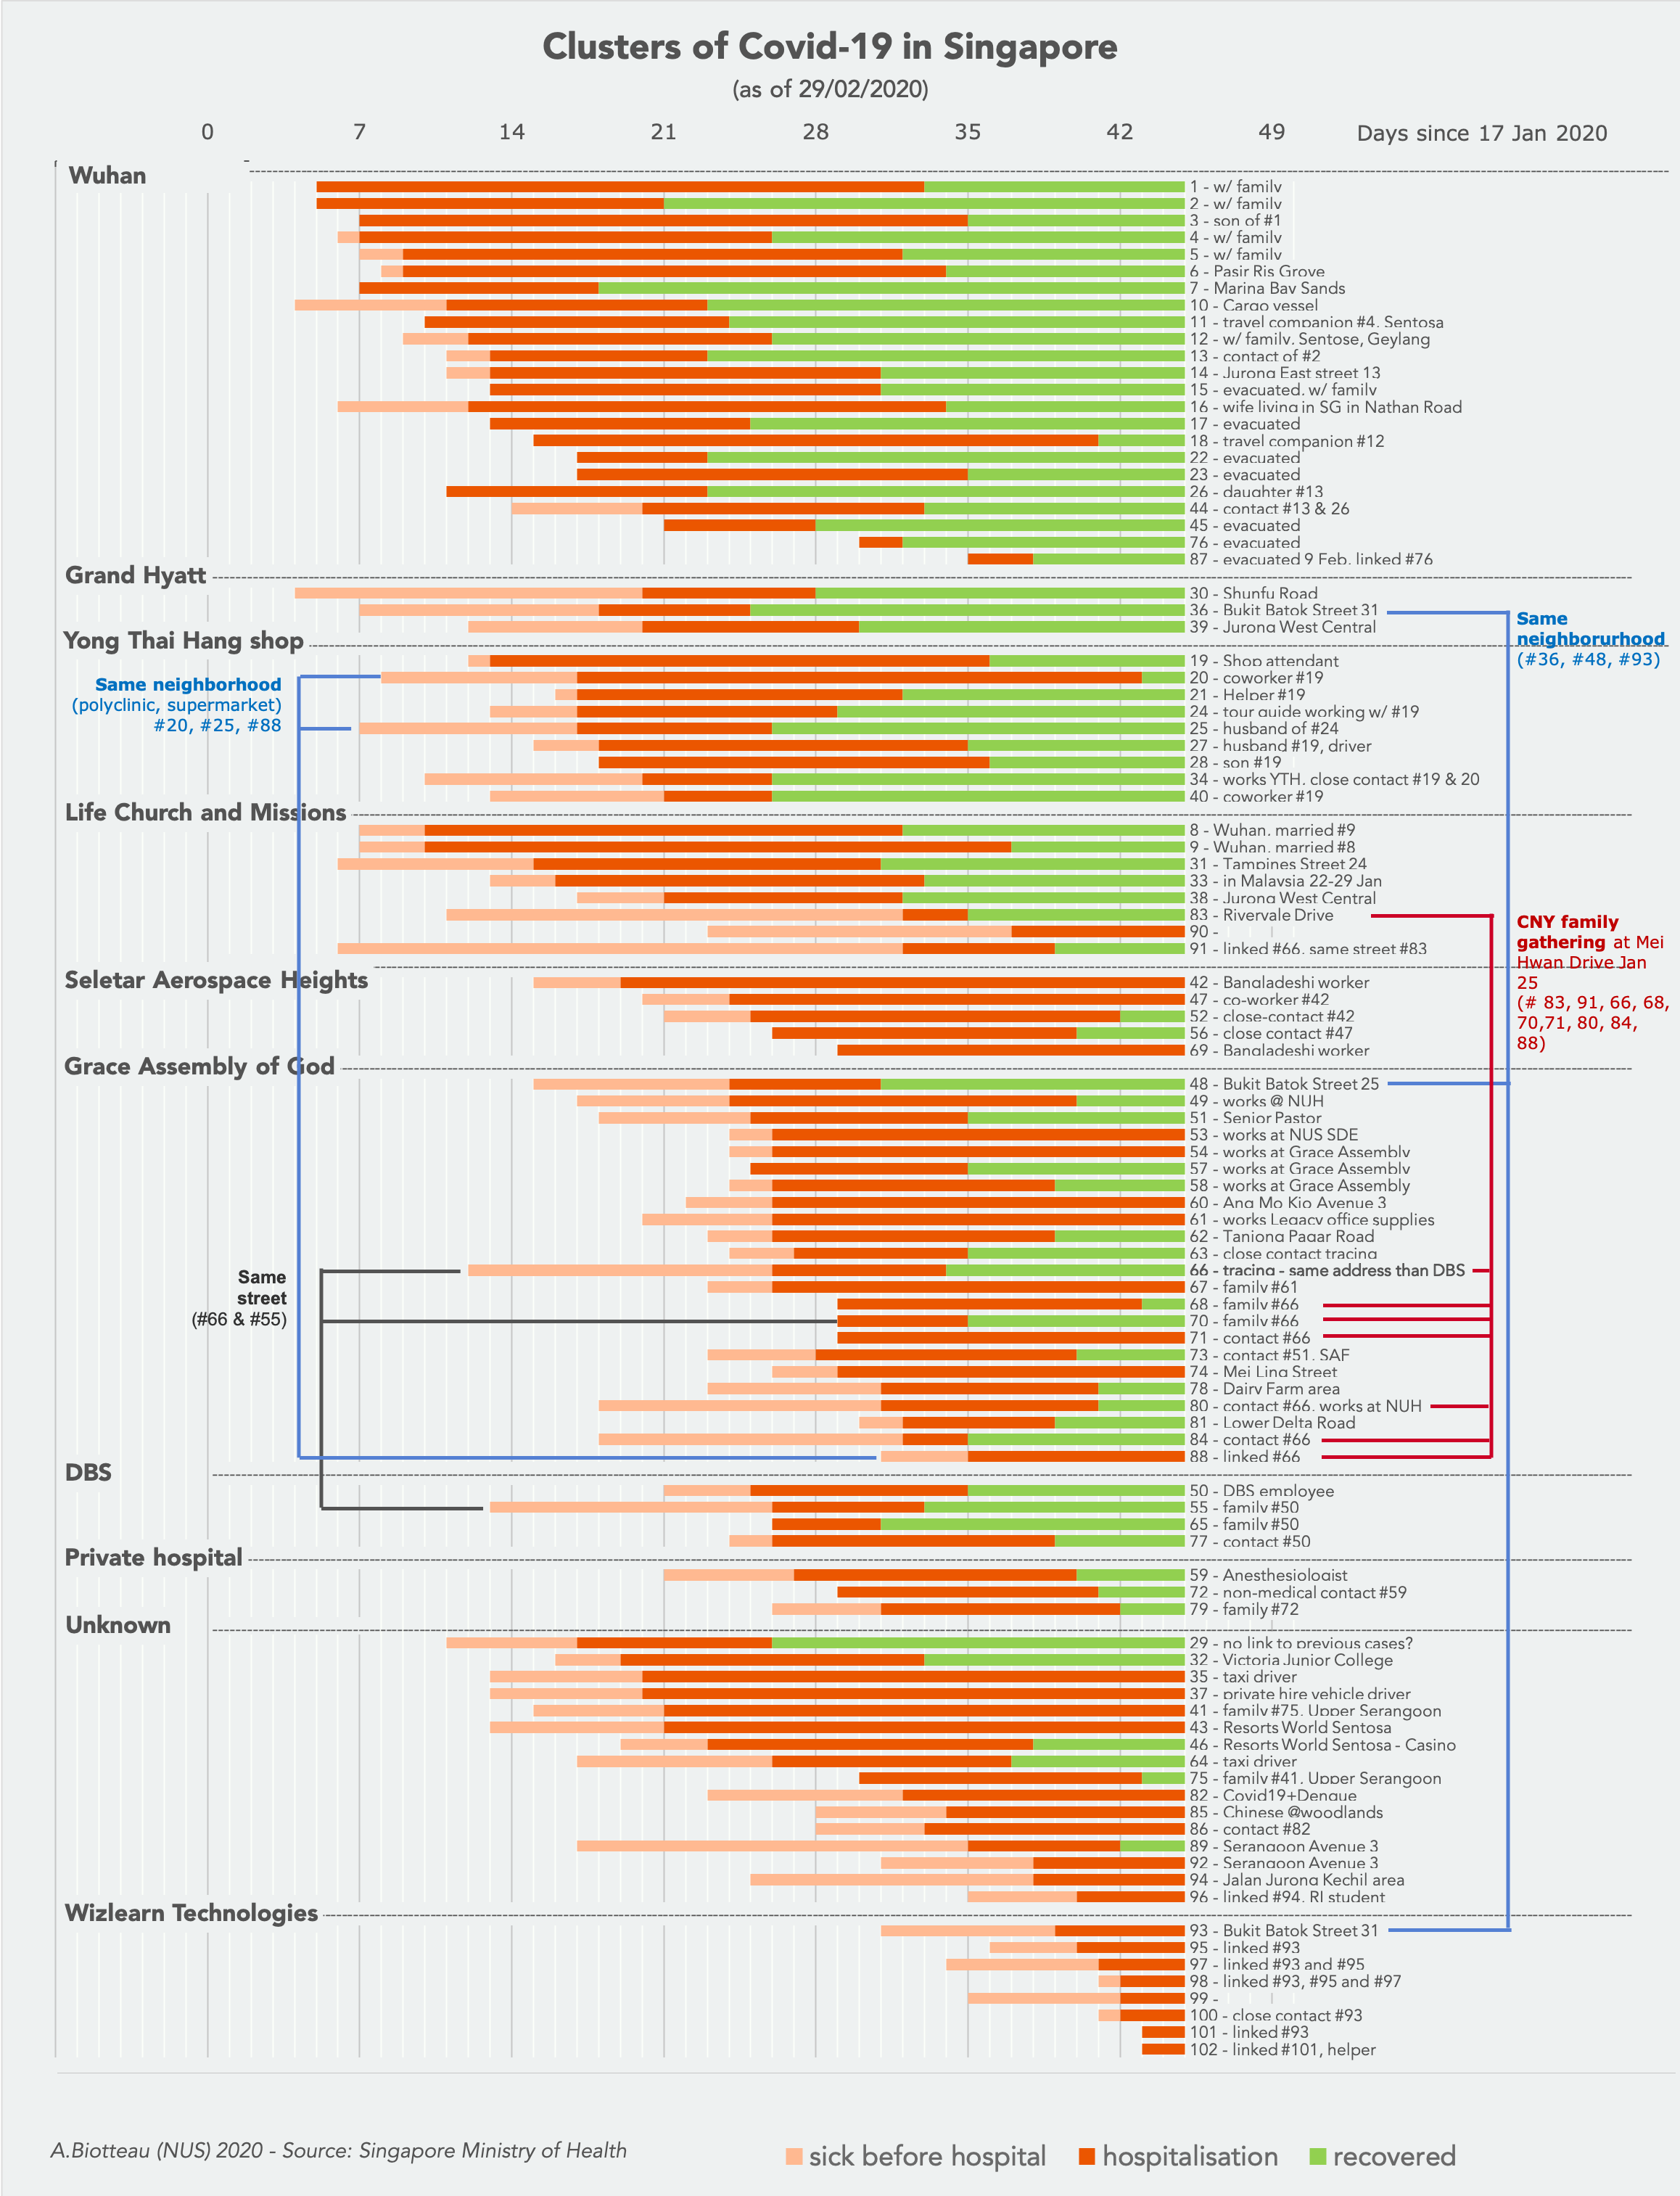
When the coronavirus outbreak started in Singapore, the Singapore Ministry of Health shared some daily information on each case. It was quite detailed and I started some charts to analyse the characteristics and location of the outbreak. It was interesting to work with these data and get more practice. The network of clusters was a bit challenging to map out, though, and I would need to learn new tools for this approach.
This timeline shows the number of new cases and recovered patients. I gathered some feedback to make it simpler to read and add annotations on main milestones. When the number of cases hit 100, I decided to stop keeping track of the outbreak in details.
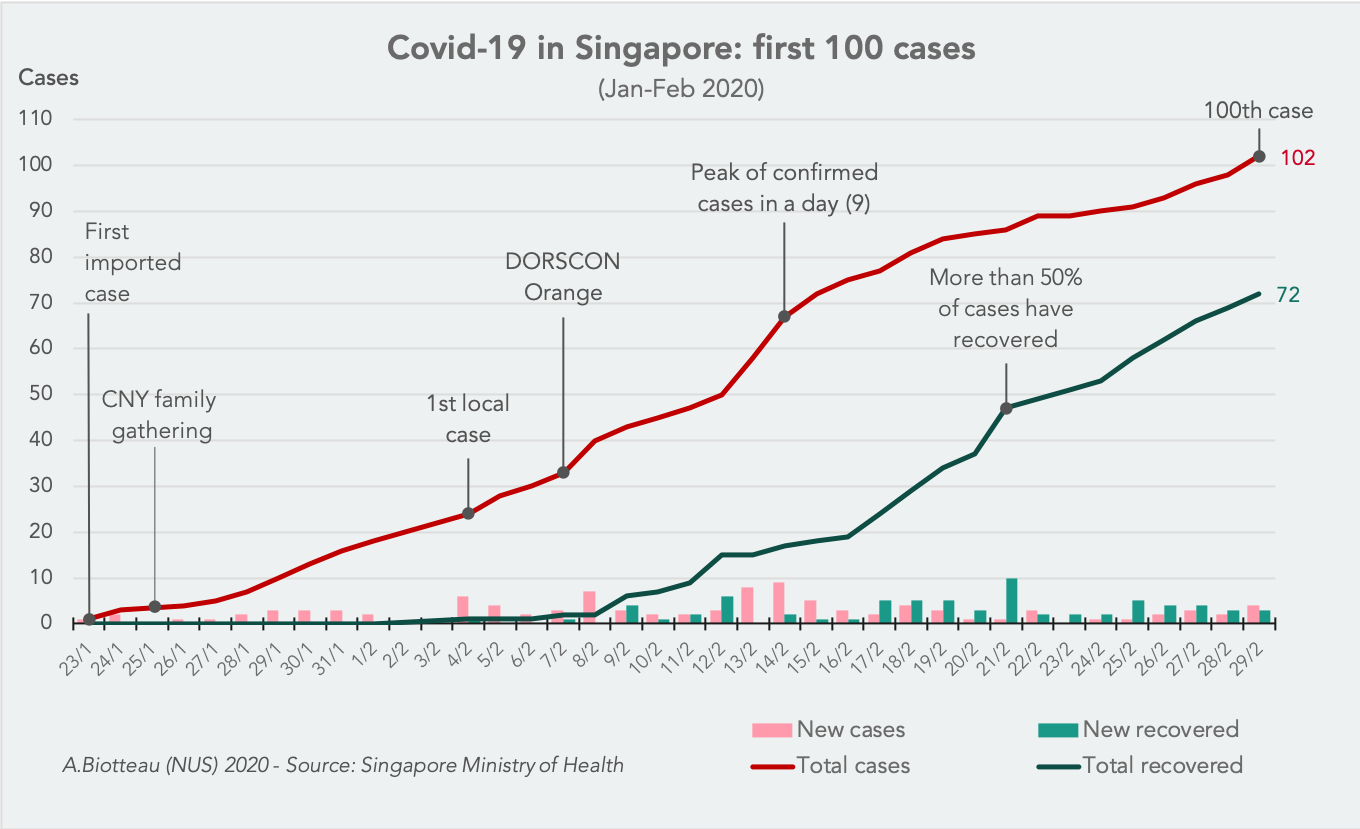

This timeline shows the number of new cases and recovered patients. I gathered some feedback to make it simpler to read and add annotations on main milestones. When the number of cases hit 100, I decided to stop keeping track of the outbreak in details.